
While you may not be a financial expert, understanding your business’s financial health is crucial for making informed decisions and ensuring your company’s profitability.
One of the most important financial statements you must understand is your income statement. In this comprehensive guide, we’ll explain what it is, its purpose, its components, and how to analyze it.
Try our online invoicing software for free

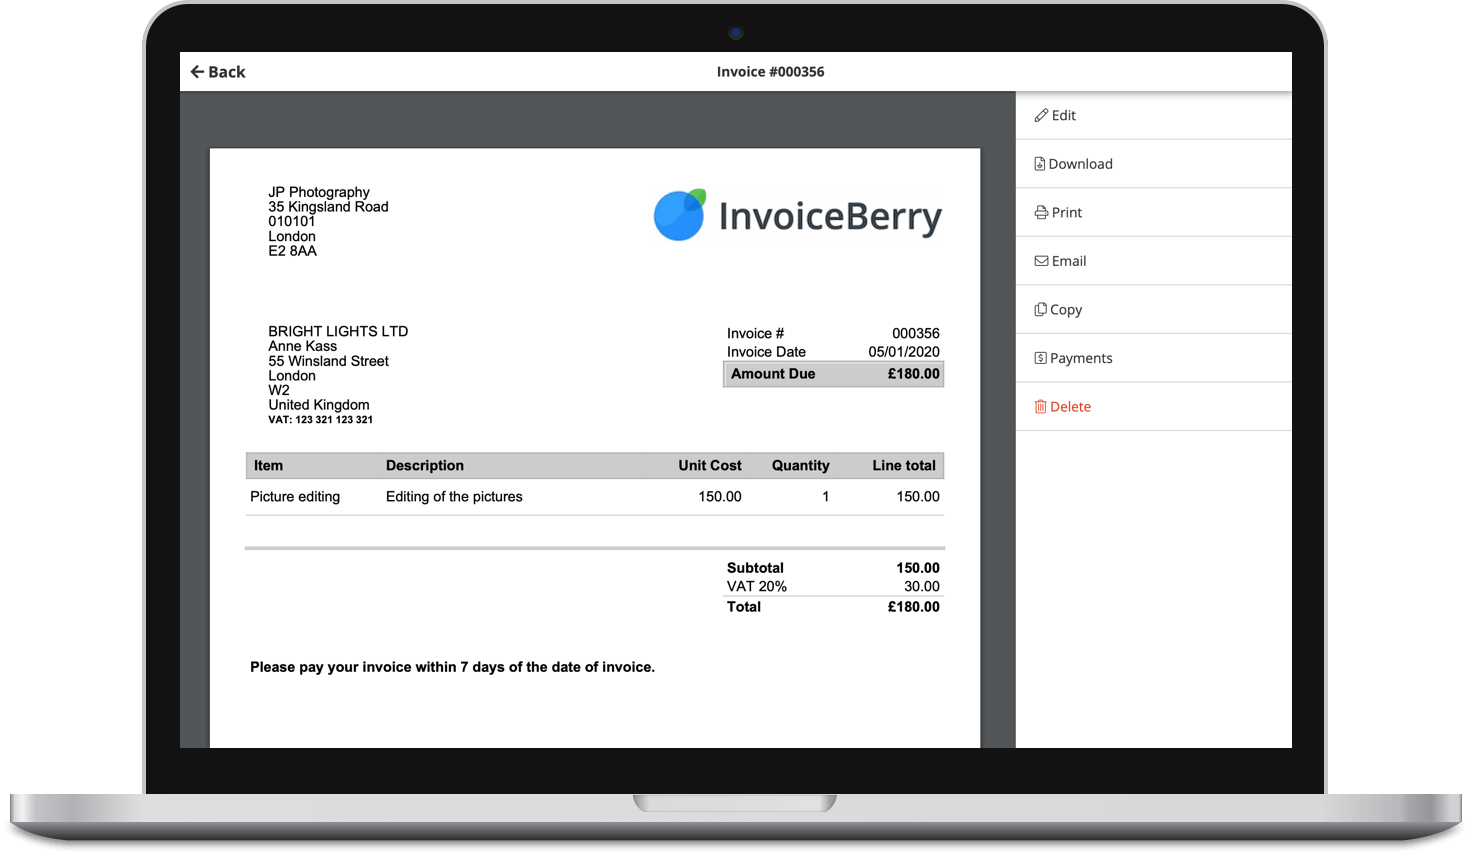
Accept online payments with ease
Keep track of who's paid you
Start sending invoices
What is an income statement?
An income statement (IS), or profit and loss statement (P&L), is a financial snapshot that summarizes your business revenues and expenses over a specific period of time (the accounting period), usually a month, quarter, or year.
Here’s a P&L statement:

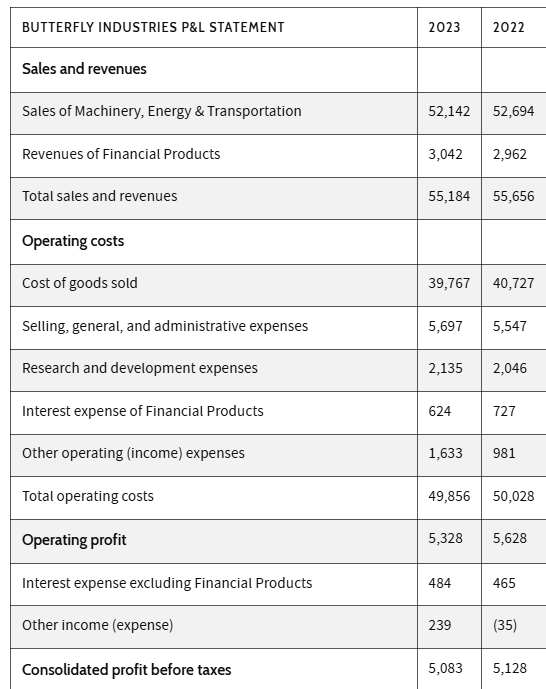
Think of it as a report card that indicates how much money your business made (revenue) and how much it spent (expenses) during that time frame to determine whether it turned a profit or not.
The income statement’s purpose and limitations
The income statement serves two main purposes:
1. To assess profitability
An income statement determines whether your business is making money or losing it. By analyzing the relationship between revenue, gains, expenses, and losses, you can gauge your company’s profitability and identify areas where you can cut costs or increase revenue. Demonstrating a consistent profit margin is often the first step to securing a lucrative B2B opportunity with larger corporate partners.
2. To evaluate performance
Beyond profitability, the income statement provides insights into your business’s overall financial performance. It helps you track trends in revenue and expenses over time, identify potential problems, and make informed decisions.
Limitations
While income statements are valuable tools, they don’t tell the whole story:
- They don’t consider cash flow, making it difficult to assess a company’s liquidity.
- They often include estimates and judgments for certain items like depreciation.
- They neglect non-financial factors that can impact a company’s performance.
Income statements vs. balance sheets vs. cash flow statements
The income statement is one of three consolidated financial statements. The other two are your balance sheet and your cash flow statement. Together, they give you a more in-depth view of your finances.
- Income statements focus on your business’s profitability and performance over a specific reporting period.
- The balance sheet lists your business’s assets, liabilities, and equity, providing a snapshot of your company’s financial position at a given moment in time.
- The cash flow statement assesses a company’s liquidity and ability to generate cash.
Components of an income statement
There are three main components in an income statement:
- Revenues: the money your business earns from its core activities, including operating and non-operating revenues.
- Expenses: Expenses are the direct and indirect costs your business incurs to operate and generate revenue. They include the cost of sales, operating expenses, non-operating expenses, and losses from selling assets for less than their book value.
- Net income: The difference between income and costs, which reflects the organization’s financial success.
However, the multi-step income statement breaks these down into their individual components and calculates several performance metrics along the way.
Here’s a sample income statement from the tech giant Apple Inc. (2023) with the broken-down costs and revenues:

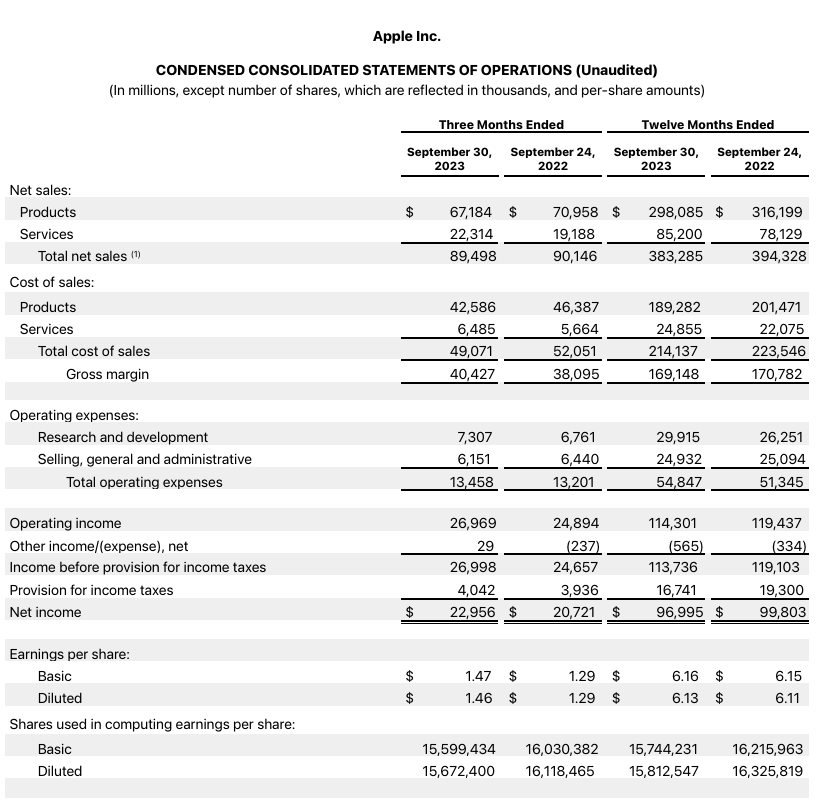
Let’s dive into each one of these items separately:
Net sales
Sales revenue is part of the operating revenue generated from your primary business activities, such as selling products or providing services.


Cost of sales or cost of goods sold (COGS)
The cost of sales, or COGS, represents the direct costs of creating a company’s products or services and typically includes:
- Manufacturing overhead
- Direct materials
- Direct labor


Gross profit or gross margin
Subtracting the total Cost of Sales or COGS from the Net Sales (revenue) gives us the Gross Profit for a given time period. The Gross Profit margin indicates how efficiently your company produces its goods or services.
Operating expenses
These are the direct costs associated with running your business. Here are examples of operating expenses:
- Selling, General, and Administrative expenses (SG&A) like:
- Utilities and rent
- Office supplies
- Marketing
- Salaries
- Research and Development (R&D) expenses
- Depreciation expenses and amortization


Operating income or EBIT
Operating income, which you can also call Earnings Before Interest and Taxes (EBIT), measures a company’s profitability from its core business operations.


You calculate it by subtracting your operating expenses from the gross profit.
Other income (Expense)
Other sources of income and expenses for a business include:
- Other non-operating income and expenses
- Gains and losses on asset sale
- Interest income and expenses
Earnings before taxes (EBT)
Also called income before taxes or pretax income, EBT is the amount of income your company earned before subtracting the income tax expense for the period.


This figure represents your company’s profit margin after all operating and non-operating expenses have been accounted for.
Income tax expense
The provision for income taxes is the amount of taxes your company is required to pay by law.


If you report a loss in your EBT, you don’t pay this tax.
Net income
Net income, (net profit margin or net earnings), is calculated as:
Net Income = (EBT) – (Income Tax)


It represents a company’s total earnings or profit margin after all expenses have been deducted from total revenue.
Earnings per share (EPS)
Earnings per share (EPS) indicates how much profit a company generates for every outstanding share of its common shares.


There are two types of EPS:
Basic EPS
Represents the company’s EPS if no additional shares were issued. It’s calculated by dividing net income available by the weighted average number of common shares outstanding during the period.
Diluted EPS (if applicable)
This EPS assumes the potential increase in the number of shares outstanding and the resulting EPS dilution if all convertible securities were converted into common shares.
How to read and understand income statements
Now that you’re familiar with the components of an IS, let’s explore how to analyze them to get to know more about your business’ financial health.
Understanding income statement structure
While the Generally Accepted Accounting Principles (GAAP) don’t provide a specific income statement template, most follow a similar structure to the one shown above for Apple.
This structure makes it easy to see the relationship between revenue and expenses and determine whether your business is profitable.
Financial analysis
The key to using income statements effectively is tracking metrics like Net Income, Earnings Per Share (EPS), pretax income, and other business performance metrics.
Each one tells a part of your company’s financial activities and performance story. The most effective way to do this analysis is using accounting software, an approach similar to creative analytics, where data is used to evaluate and improve performance.
Analyzing profitability in a high-value service model
To truly understand how to analyze an income statement, it’s helpful to consider a high-value service model. Let’s take a specialized historical travel business, such as the Beaches of Normandy tour. Unlike mass tourism, this is a premium niche offering that allows us to see how performance and profitability complement each other in a specialized market.
To interpret the income statement from this perspective, it is necessary to evaluate the following areas:
Pricing power relative to revenue: Since this tour offers an educational experience that is difficult to replicate, the company has greater pricing power, resulting in higher gross revenue relative to the number of clients.
COGS (Cost of Goods Sold) analysis: In this model, COGS includes expert historians, premium transportation, and exclusive site access. If the income statement shows a healthy gross profit, it means the company is successfully managing these inputs without overspending.
Operational efficiency: Low marketing costs, combined with comprehensive tours, indicate a strong brand reputation and high performance.
Analyzing the figures of a specialized company like this demonstrates that profitability is not based solely on cost reduction, but on creating unique value that justifies a premium price.
Vertical analysis of an IS
Vertical analysis is the process of representing each item in a column of the income statement as a proportion of the total revenue.

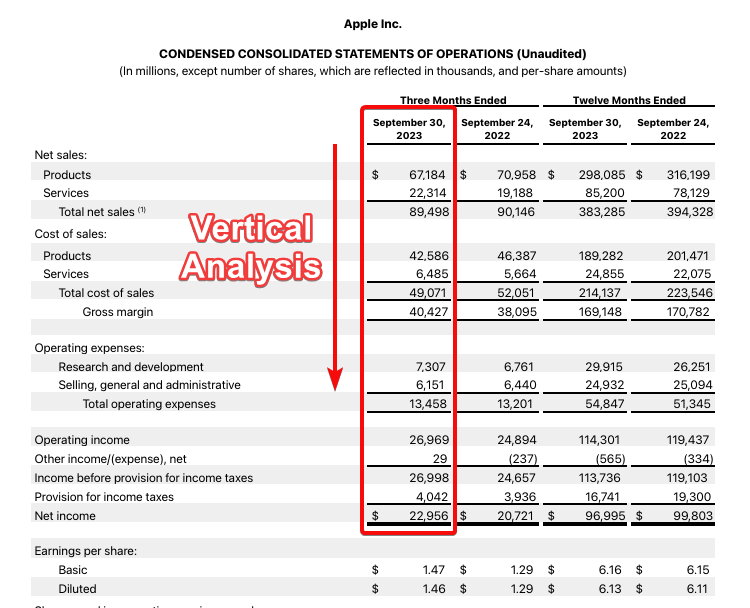
This allows you to see the proportion of revenue that’s allocated to different expenses and identify areas where you can potentially cut costs.
Horizontal analysis of an IS
Horizontal analysis involves comparing your income statement over multiple reporting periods to identify trends in revenue and expenses and forecast future performance.

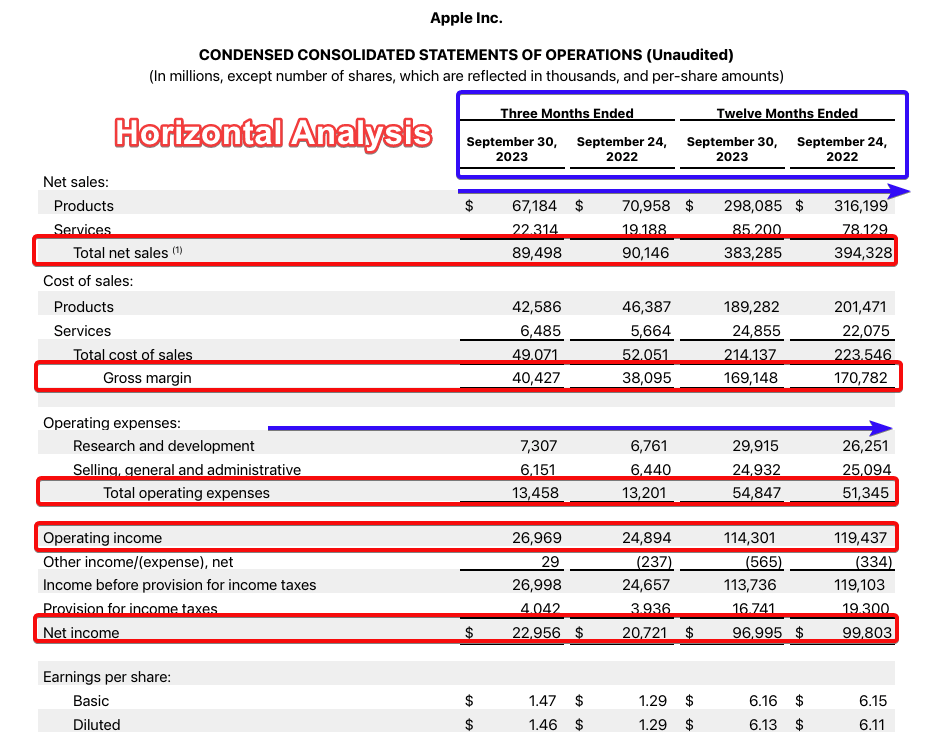
This analysis can help you spot potential problems early on, even during the discovery phase of a project, and make informed decisions about your business’s future.
Wrapping up
Accurately tracking your business expenses is essential for understanding your income statement and making informed financial decisions. When your financial data is organized and up to date, it becomes much easier to analyze profitability, identify performance trends, and plan for sustainable growth.
InvoiceBerry helps simplify this process by giving small businesses and freelancers an easy way to manage invoices, monitor expenses, and maintain clear financial records — all in one place. With better visibility into your numbers, you can spend less time on manual tracking and focus more on improving your business’s financial performance.
Ready to take control of your income statements and cash flow? Visit InvoiceBerry to see how streamlined invoicing and expense tracking can support smarter financial decisions.